
Nepal Finance Limited (NFS) publishes its 4th quarter report, Net profit decreased by 10%, eps at 2.48 (-29%)
NFS published its 4th quarter report 2080/81

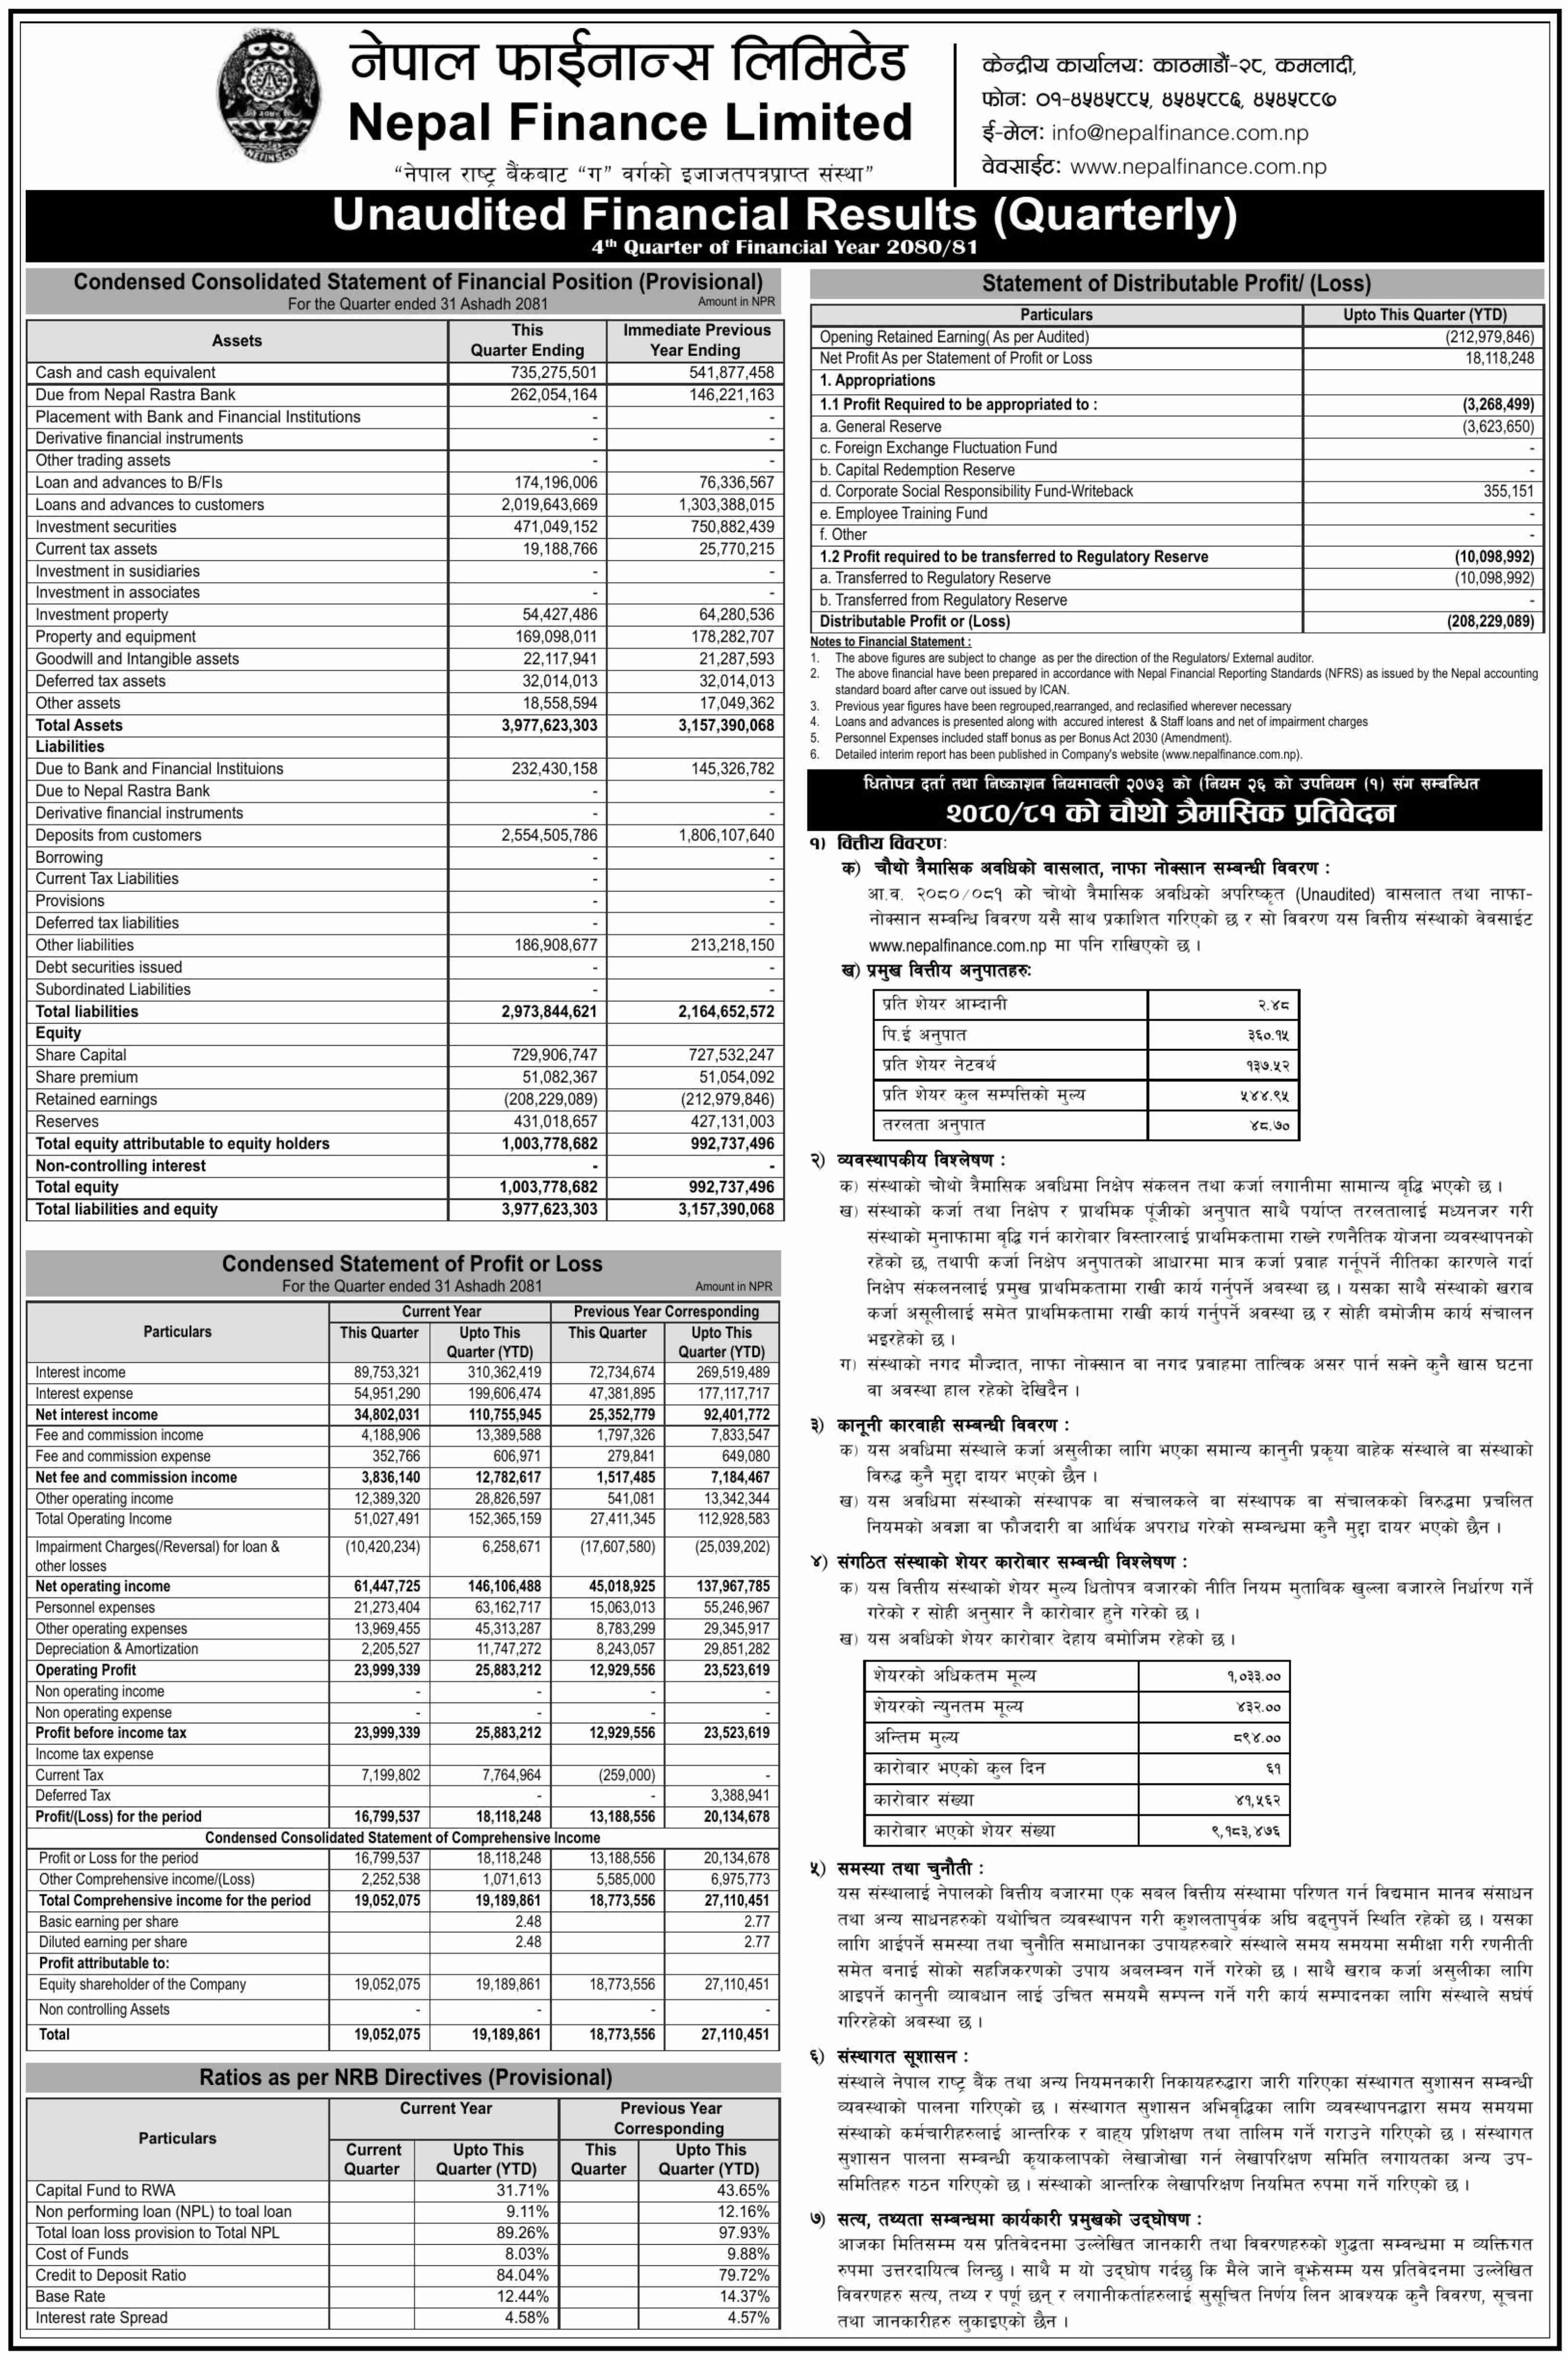
Nepal Finance Limited (NFS), a listed company on the Nepal Stock Exchange (NEPSE), has recently published its 4th quarter financial report for the fiscal year 2080/81. Despite the rapid increase in its share price, the report indicates a disappointing performance.
Key Financial Highlights:
- Net Profit: NFS reported a total net profit of Rs 1,81,18,248, a decline of 10.01% from the previous year's Rs 2,01,34,678.
- Earnings Per Share (EPS): The EPS for this fiscal year stands at Rs 2.48, down 29.74% from the previous year's Rs 3.53.
- Price-to-Earnings (PE) Ratio: The PE ratio is alarmingly high at 360.15, calculated when the share price was Rs 894.
- Net Worth Per Share: The net worth per share is Rs 137.52.
- Non-Performing Loans (NPL): There is a notable improvement in NPL, which decreased to 9.11% from the previous year's 12.16%, a 25.08% decrease.
- Operating Profit: The operating profit increased by 10.02%, rising to Rs 2,58,83,212 from the previous year's Rs 2,35,23,619.
- Interest Income: Interest income grew by 19.86%, reaching Rs 11,07,55,945 compared to the previous year's Rs 9,24,01,772.
| Particulars (In Rs '000) | Nepal Finance Limited | ||
|---|---|---|---|
| Q4 2080/81 | Q4 2079/80 | Difference | |
| Paid Up Capital | 729,906.75 | 727,532.25* | 0.33% |
| Share Premium | 51,082.37 | 51,054.09* | 0.06% |
| Retained Earnings | -208,229.09 | -212,979.85* | - |
| Reserves | 431,018.66 | 427,131.00* | 0.91% |
| Deposits | 2,554,505.79 | 1,806,107.64* | 41.44% |
| Loans & Advances to Banks and FIs | 174,196.01 | 76,336.57* | 128.19% |
| Loans & Advances to Customers | 2,019,643.67 | 1,303,388.02* | 54.95% |
| Net Interest Income | 110,755.95 | 92,401.77 | 19.86% |
| Personnel Expenses | 63,162.72 | 55,246.97 | 14.33% |
| Impairment Charges | 6,258.67 | -25,039.20 | - |
| Operating Profit | 25,883.21 | 23,523.62 | 10.03% |
| Net Profit | 18,118.25 | 20,134.68 | -10.01% |
| Capital Adequacy (%) | 31.71 | 43.65 | -27.35% |
| NPL (%) | 9.11 | 12.16 | -25.08% |
| Cost of Fund (%) | 8.03 | 9.88 | -18.72% |
| Annualized EPS (In Rs.) | 2.48 | 2.77 | -10.31% |
| Net Worth per Share (In Rs.) | 137.52 | 136.45 | 0.78% |
| Qtr End Market Price | 894 | - | - |
* Figures are of Immediate Previous Year Quarter Ending
Despite the notable improvements in operating profit and interest income, the significant declines in net profit and EPS are concerning. The reduction in non-performing loans is a positive sign, indicating improved asset quality. However, the extremely high PE ratio suggests that the current share price is heavily inflated, potentially driven by speculative trading rather than fundamental performance. The above given PE ratio is calculated when the share price was Rs 894. Given the current share price of Rs 2154, this ratio is expected to be 869.
Investors should exercise caution, considering the disparity between the company's financial performance and its rapidly increasing share price. The market may be overly optimistic, and a correction could be imminent if the financial fundamentals do not improve in the coming quarters.
Comments
0 comments · join the conversation
No comments yet
Be the first to share your thoughts.
Add a comment
Your comment will appear after a quick review.
Comment submitted
Thanks! Your comment is in the moderation queue and will appear after verification.
Reply to comment
0 replies
Reply submitted
Thanks! Your reply is in the moderation queue and will appear after verification.