
Reliance Spinning Mills Net Profit Falls 17.71% in Q3 FY 2082/83 as Production Costs, Energy Crisis and Capital Expansion Squeeze Margins
NEPSE-listed textile manufacturer Reliance Spinning Mills Limited (RSML) reported a 17.71% year-on-year decline in net profit to Rs. 26 Crore 68 Lakh 92 Thousand for the third quarter of FY 2082/83; with revenue rising only 0.93%, earnings per share came under pressure from rising costs and a recent capital expansion.
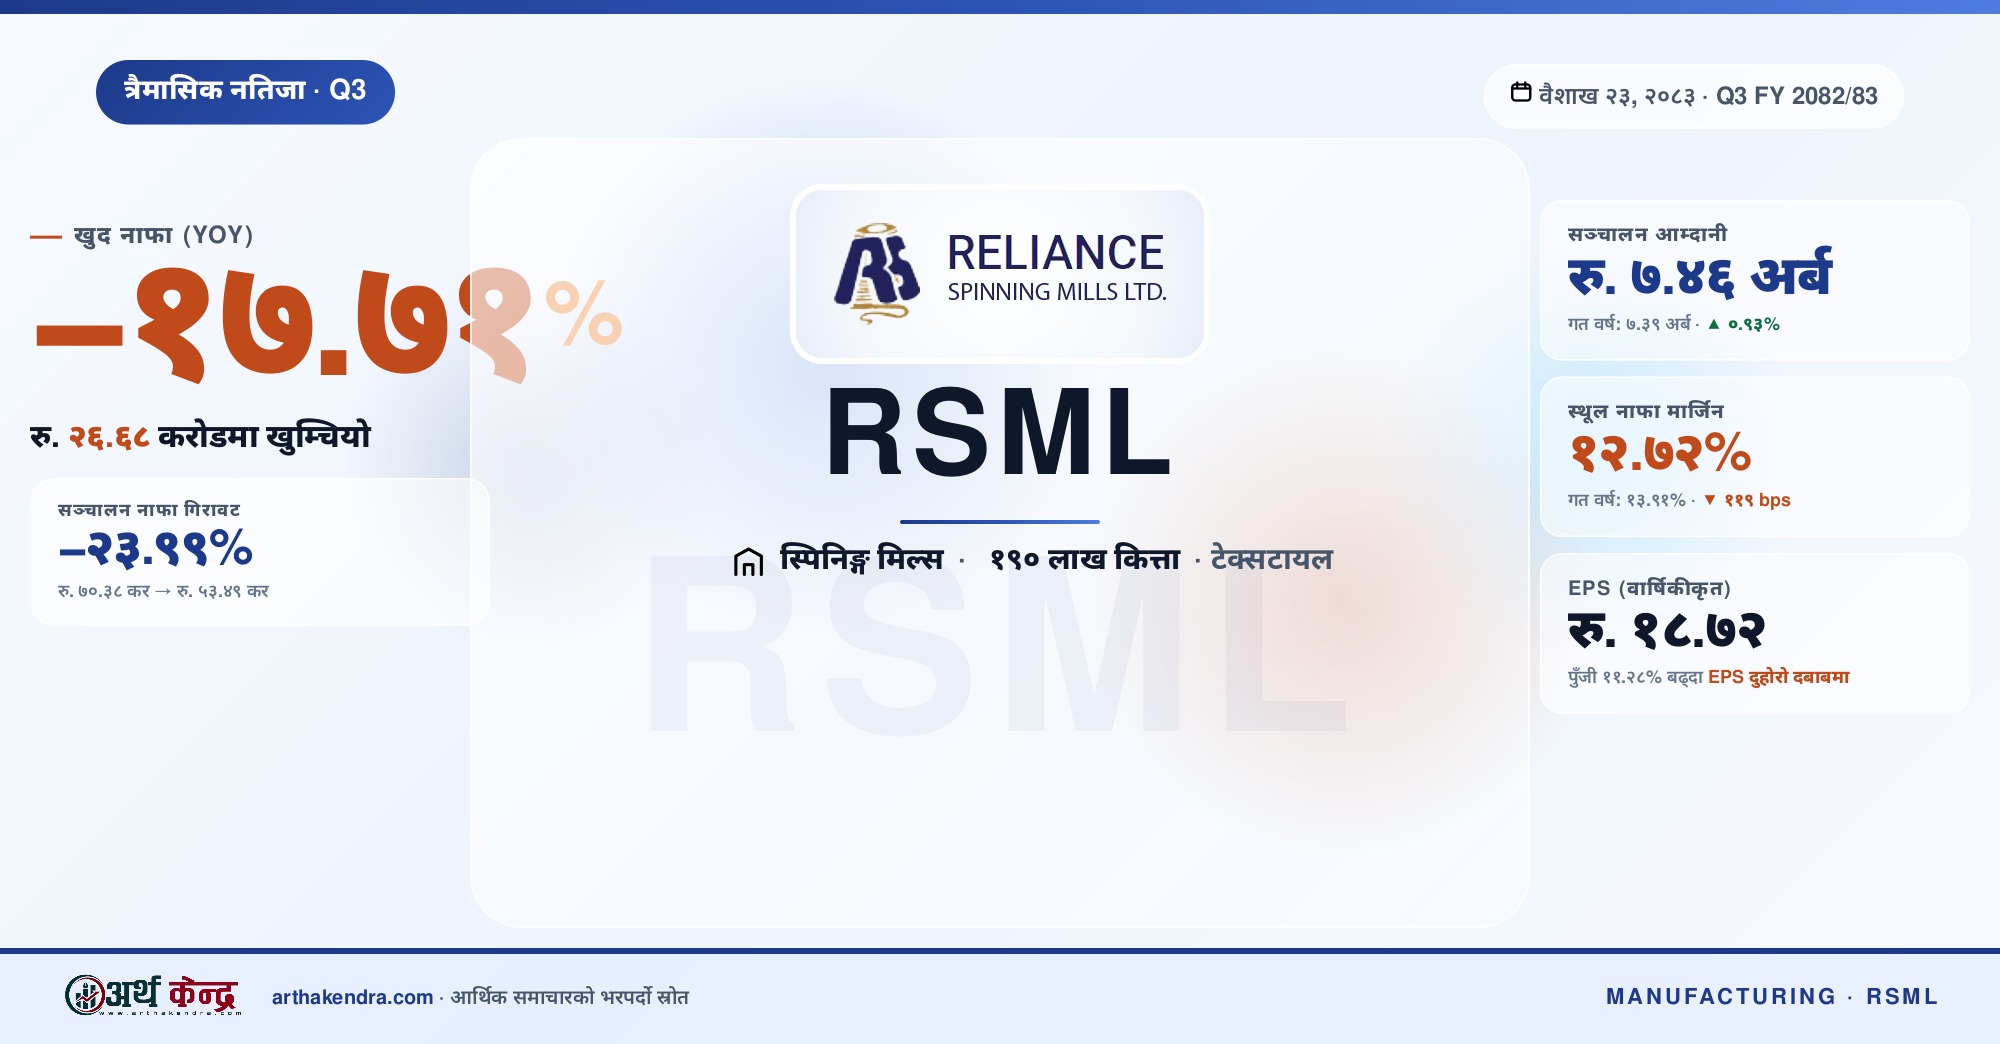
NEPSE-listed manufacturing company Reliance Spinning Mills Limited (RSML) has disclosed a sharp decline in profitability for the nine months ended Chaitra 30, 2082 (Q3 FY 2082/83). According to the company's quarterly filing, net profit fell 17.71% to Rs. 26 Crore 68 Lakh 92 Thousand (Rs. 26.69 Crore), down from Rs. 32 Crore 43 Lakh in the same period last year. 🔻
On the revenue side, operating revenue reached Rs. 7 Arba 46 Crore 4 Lakh compared with Rs. 7 Arba 39 Crore 17 Lakh a year earlier — a wafer-thin 0.93% increase 🟡. To generate that revenue the company incurred Rs. 6 Arba 51 Crore 18 Lakh in cost of sales (87.28% of revenue), up from 86.09% last year. With cost of sales rising 2.34% while revenue barely moved, gross profit dropped from Rs. 102 Crore 85 Lakh to Rs. 94 Crore 86 Lakh — a decline of 7.76% 🔻.
The pressure intensifies further down the income statement. After administrative and selling expenses, operating profit shrank 23.99% from Rs. 70 Crore 38 Lakh to Rs. 53 Crore 49 Lakh 🔻. Finance costs also moved against the company, climbing to Rs. 22 Crore 10 Lakh, leaving profit before tax (PBT) at Rs. 31 Crore 39 Lakh and net profit at Rs. 26.69 Crore.
📊 Table 1: Q3 FY 2081/82 vs Q3 FY 2082/83 — Key Indicators
| Indicator | Q3 FY 2081/82 | Q3 FY 2082/83 | Change | Direction |
|---|---|---|---|---|
| Operating Revenue | Rs. 7.39 Arba | Rs. 7.46 Arba | +0.93% | 🟢 ▲ |
| Cost of Sales | Rs. 6.36 Arba | Rs. 6.51 Arba | +2.34% | 🔴 ▲ |
| Gross Profit | Rs. 102.85 Crore | Rs. 94.86 Crore | −7.76% | 🔴 ▼ |
| Operating Profit | Rs. 70.38 Crore | Rs. 53.49 Crore | −23.99% | 🔴 ▼ |
| Finance Cost | Rs. 18.53 Crore | Rs. 22.10 Crore | +19.27% | 🔴 ▲ |
| Profit Before Tax | Rs. 46.40 Crore | Rs. 31.39 Crore | −32.34% | 🔴 ▼ |
| Net Profit | Rs. 32.43 Crore | Rs. 26.69 Crore | −17.71% | 🔴 ▼ |
| Gross Profit Margin | 13.91% | 12.72% | −119 bps | 🔴 ▼ |
| Net Profit Margin | 4.39% | 3.58% | −81 bps | 🔴 ▼ |
💰 IPO / Capital Expansion — Before and After
RSML's paid-up capital expanded from Rs. 1 Arba 70 Crore 73 Lakh to Rs. 1 Arba 90 Crore mid-year — an increase of Rs. 19 Crore 26 Lakh (11.28%) 🟢 ▲. The expansion happened between Q1 (Kartik-end 2082) and Q2 (Poush-end 2082) of the current fiscal year; the Q1 FY 2082/83 filing still showed paid-up capital at Rs. 1.70 Arba, while the Q2 filing onward shows Rs. 1.90 Arba.
Alongside the paid-up capital expansion, the company's total equity rose from Rs. 7 Arba 53 Crore to Rs. 9 Arba 45 Crore — a Rs. 1 Arba 92 Crore jump in nine months. Of that increase, only Rs. 19.26 Crore went to share capital; the rest sits in Other Equity. This suggests the capital expansion came through bonus shares (capitalised from reserves) and possibly a rights/FPO with share-premium retained earnings.
📋 Table 2: Equity Structure — Before and After Capital Expansion
| Capital Indicator | Annual FY 2081/82 (Year-end) |
Q3 FY 2082/83 (Chaitra-end) |
Change |
|---|---|---|---|
| Paid-up Capital | Rs. 1.70 Arba | Rs. 1.90 Arba | +Rs. 19.26 Crore (+11.28%) |
| Other Equity / Reserves | Rs. 5.82 Arba | Rs. 7.55 Arba | +Rs. 1 Arba 73 Crore |
| Total Equity | Rs. 7.53 Arba | Rs. 9.45 Arba | +Rs. 1 Arba 92 Crore (+25.5%) |
| Total Borrowings | ~Rs. 3.09 Arba | Rs. 2.56 Arba | −Rs. 53 Crore |
📉 Capital Expansion Adds a Second Drag on EPS
Because the share count rose 11.28%, earnings per share (EPS) fell harder than the headline profit decline. In Q3 of FY 2081/82, EPS on the old 1.70 Crore-share base was Rs. 19.00 (Rs. 32.43 Crore ÷ 1.70 Crore shares). For the current quarter, with profits down and share count up, the nine-month EPS dropped to Rs. 14.04 (Rs. 26.69 Crore ÷ 1.90 Crore shares) 🔴 ▼. If the share count had remained unchanged, EPS would have been Rs. 15.63 — meaning of the total Rs. 4.96 EPS decline, Rs. 3.37 came from falling profit and Rs. 1.59 from share dilution.
This "EPS-falls-after-IPO/bonus" pattern is common across NEPSE-listed companies: the company takes time to deploy fresh capital productively while the share count rises immediately. In the short run, per-share metrics come under heavy pressure.
📋 Table 3: Per-Share Indicators and Balance Sheet (Q3 FY 2082/83)
| Indicator | Value | Note |
|---|---|---|
| Paid-up Capital | Rs. 1.90 Arba | 1.90 Crore shares × Rs. 100 |
| Other Equity (Reserves + Premium) | Rs. 7.55 Arba | 79.9% of total equity |
| Total Equity | Rs. 9.45 Arba | Last year Q3: Rs. 7.38 Arba |
| Total Assets | Rs. 14 Arba 0.9 Crore | Fixed assets: Rs. 9.37 Arba (66.9%) |
| Total Borrowings (current + non-current) | Rs. 2.56 Arba | Debt/Equity: 0.27× |
| EPS (annualised) | Rs. 18.72 | (26.69 Cr × 4/3) ÷ 1.90 Cr shares |
| Net Worth per Share | Rs. 497.37 | Rs. 9.45 Arba ÷ 1.90 Crore shares |
⚠️ Why Profit Fell — The Four Headwinds
1. Rising production costs 🔴 — Cost of sales rose to 87.28% of revenue (versus 86.09% last year). Volatile international cotton prices, US dollar exchange-rate swings, and shifting global trade policy have all pressured input costs.
2. Energy crisis and unannounced load-shedding 🔴 — The Nepal Electricity Authority (NEA) has been cutting power to industrial consumers without notice, disrupting production continuity. The dedicated-feeder / trunk-line tariff dispute is also ongoing at the Patan High Court.
3. Higher finance costs 🔴 — Interest expense rose 19.27% from Rs. 18.53 Crore to Rs. 22.10 Crore, reflecting capex-driven borrowing and higher working-capital needs.
4. Capacity expansion and depreciation 🟡 — Property, plant and equipment now stands at Rs. 9.37 Arba — 66.9% of total assets. New machinery brings additional depreciation and finance burden, putting near-term pressure on profit before the new capacity ramps up.
Comments
0 comments · join the conversation
No comments yet
Be the first to share your thoughts.
Add a comment
Your comment will appear after a quick review.
Comment submitted
Thanks! Your comment is in the moderation queue and will appear after verification.
Reply to comment
0 replies
Reply submitted
Thanks! Your reply is in the moderation queue and will appear after verification.